Contour Lines explained
Contours can be thought of as like a stack of irregular pancakes, with each contour line representing the edge of the pancake. If the contour interval is 1 metre, each ‘pancake’ would be 1 meter thick. A 100 metre contour represents a line on the ground that is 100 metres above a vertical datum such as mean sea level.
-
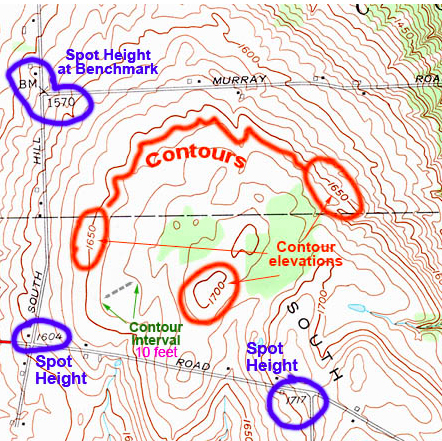
Contours, source: http://www.acsu.buffalo.edu/~dbertuca/maps/cat/map-portion-images.html
Contour Interval
Contour Interval is the vertical distance between consecutive contour lines, a 10 meter contour interval means that there is a 10 meter difference in height between one contour line and the next. On a topographic map the contour interval is usually stated somewhere in the map legend, or under the map scale bar.
Index and Intermediate Contours
Index contours are thicker and are usually every fifth contour line, if the contour interval is say 20 metres the index contour would be on every 100 metres above sea level
Contour Labels
Contour elevations or values are often labelled along the contour line and if labelled correctly read uphill, ie when reading the value the contour line above the value will be higher by one contour interval and the contour line below the label will be one interval lower.
Depression Contours
Depression contours indicate a hole or depression on the general terrain, they are marked with a regular tick along one side of the contour line. The side that the ticks appear is the lower, or downhill, side.
Reblogged this on Geokult.